Balanced Lattice Design
The lattice design is the incomplete block design most commonly used in agricultural research. Generally, two types of lattice designs are used in agricultural research - the balanced lattice and the partially balanced lattice designs. In both designs, the number of treatments must be a perfect square. This module provides the analysis of balanced lattice design.
Characteristics of Balanced Lattice Design
- The number of treatments (t) must be a perfect square.
- The block size (k) is equal to the square root of the number of treatments.
- The number of replications (r) is one more than the block size, i.e., r = (k + 1).
For example, the number of replications required for 25 treatments is 6, 7 for 36 treatments, 8 for 49 treatments, and so on.
Randomization and Layout
Suppose we have 9 treatments; then there should be four replications, each consisting of three incomplete blocks with each block containing three experimental plots. The steps to follow are:
- Divide the experimental area into r = (k +1) replications, each containing t = k² experimental plots.
- Select a basic balanced lattice plan corresponding to the number of treatments to be tested from published plans.
- Randomize the replication arrangement of the selected basic plan by selecting three digits random numbers and rank them from lowest to highest. Use the sequence to represent the existing replication number of the basic plan and the rank to represent the replication number of new one Suppose we get four three-digit numbers as 372, 217, 963, and 404. Now rank these random numbers from lowest to highest as.
- 4. Randomise incomplete blocks within each replication and finally following treatment arrangement in each replication is obtained as
For our example, the experimental area is divided into 4 replications each containing t = 9 experimental plots as shown below:
B1	1	2	3		10	11	12		19	20	21		28	29	30
B2	4	5	6		13	14	15		22	23	24		31	32	33
B3	7	8	9		16	17	18		25	26	27		34	35	36
	Replication I		Replication II		Replication III		Replication IV
For our example, such a plan is given below:
Incomplete 	Treatment Number
Blok No	Rep I	Rep II	Rep III	Rep IV
1	1 2 3	1 4 7	1 5 9	1 6 8
2	4 5 6	2 5 8	2 6 9	2 4 9
3	7 8 9	3 6 9	3 4 8	3 5 7
Random 	Sequence Rank
NO.
372	1	2
217	2	1
963	3	4
404	4	3

ow randomize replication as per ranks
Incomplete 	Treatment Number
Blk No	Rep I	Rep II	Rep III	Rep IV
1	1 4 7	1 2 3	1 6 8	1 5 9
2	2 5 8	4 5 6	2 4 9	2 6 9
3	3 6 9	7 8 9	3 5 7	3 4 8
B1	T9	T3	T6		T5	T4	T6		T7	T5	T3		T1	T9	T5
B2	T8	T5	T2		T3	T2	T1		T6	T8	T1		T4	T8	T3
B3	T7	T1	T4		T9	T8	T7		T2	T4	T9		T7	T2	T6
	   Replication I		   Replication II		   Replication III		Replication IV
Example
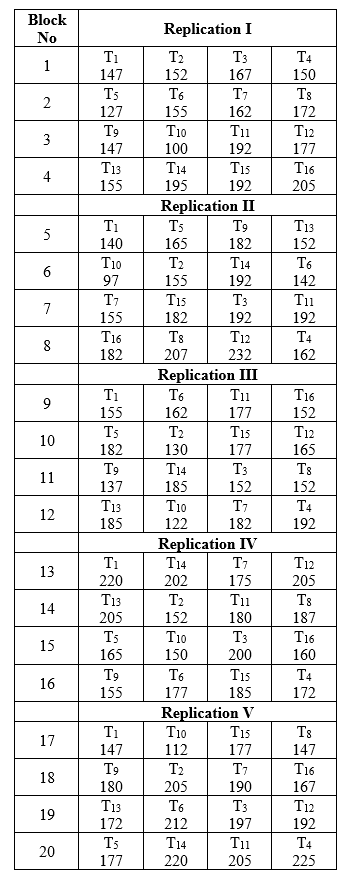
The data recorded on the number of Tillers per square meter from 16 fertilizer treatments tested in a 4 x 4 Balanced Lattice Design (taken from "Statistical Procedure for Agricultural Research" by Gomez and Gomez, page 46).

Data Arrangement
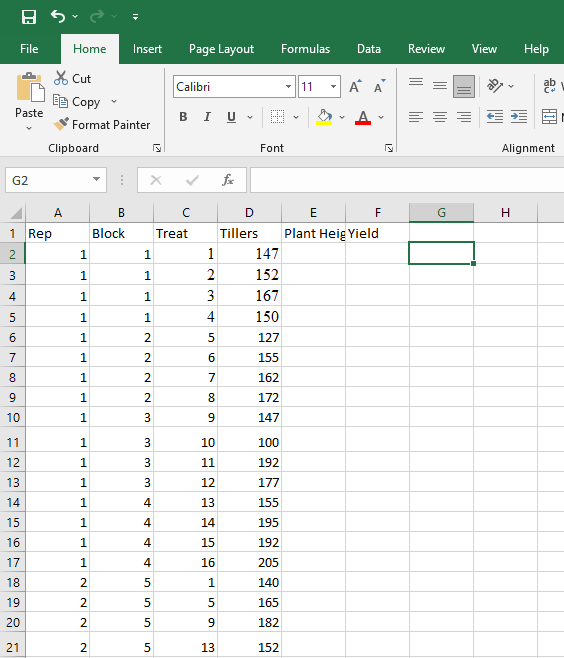
First, arrange the data in an Excel sheet. The first column contains the replication number, the second column contains the block code, the third column contains the treatment code, and the observed values for the various characters (such as plant height, no. of tillers, and yield) are entered in subsequent columns. First few lines of above example as shown belog:

The sample final data which is pasted in text area of above example is given below. You can also copy this data to test the module
1	1	1	147
1	1	2	152
1	1	3	167
1	1	4	150
1	2	5	127
1	2	6	155
1	2	7	162
1	2	8	172
1	3	9	147
1	3	10	100
1	3	11	192
1	3	12	177
1	4	13	155
1	4	14	195
1	4	15	192
1	4	16	205
2	5	1	140
2	5	5	165
2	5	9	182
2	5	13	152
2	6	10	97
2	6	2	155
2	6	14	192
2	6	6	142
2	7	7	155
2	7	15	182
2	7	3	192
2	7	11	192
2	8	16	182
2	8	8	207
2	8	12	232
2	8	4	162
3	9	1	155
3	9	6	162
3	9	11	177
3	9	16	152
3	10	5	182
3	10	2	130
3	10	15	177
3	10	12	165
3	11	9	137
3	11	14	185
3	11	3	152
3	11	8	152
3	12	13	185
3	12	10	122
3	12	7	182
3	12	4	192
4	13	1	220
4	13	14	202
4	13	7	175
4	13	12	205
4	14	13	205
4	14	2	152
4	14	11	180
4	14	8	187
4	15	5	165
4	15	10	150
4	15	3	200
4	15	16	160
4	16	9	155
4	16	6	177
4	16	15	185
4	16	4	172
5	17	1	147
5	17	10	112
5	17	15	177
5	17	8	147
5	18	9	180
5	18	2	205
5	18	7	190
5	18	16	167
5	19	13	172
5	19	6	212
5	19	3	197
5	19	12	192
5	20	5	177
5	20	14	220
5	20	11	205
5	20	4	225
Copy the numeric data and paste it into the text area provided on the left side of this web page. Specify the character names (without spaces) in the text area provided on the right side, then press the submit button.
A new page will display the analysis. You will be asked to specify the total number of characters to be analyzed and the number of treatments (which must be a perfect square).