Strip-Plot Design
Introduction
In case of two factors, sometimes these factors require larger experimental units. If all the treatment combinations of these two factors are laid out in RBD then these experimental units become large causing heterogeneity. In these situations strip plot design is used. The strip-plot design is a two-factor experiment conducted in a situation when we need more precision for interaction effect than that of main factors effects. In Strip Plot design first factor is known as vertical strip plot or vertical factor, second factor also known as Horizontal strip plot and their interaction as intersection plot. The vertical-strip plot and the horizontal-strip plot are always perpendicular to each other. However, there is no relationship between their sizes, unlike the case of main plot and subplot of the split-plot design. The intersection plot is, of course, the smallest. Thus, in a strip-plot design, the degrees of precision with the main effects of both factors are sacrificed in order to associated improve the precision of the interaction effect.
Randomization and Layout
Layout, analysis procedure and example for testing the script is taken from the Book Statistical Procedures For Agricultural Research 2nd Edition by Gomez and Gomez.
The layout of strip-plot design consists of two independent randomization processes – one for horizontal factor and another for the vertical factor. Suppose A represent the horizontal factor and B represents the vertical factor. Let a and b are their levels and suppose we have r replications. For example we have an two factor experiment involving six rice varieties (horizontal treatment) and three nitrogen rates (vertical treatments) tested in strip-plot with three replications. The layout of the design has following steps
Step 1: Horizontal Factor Randomization
Divide the experimental area into r = 3 blocks and each block is divided in a = 6 horizontal strip. Six varieties (V1 to V6) are allotted at random to these 6 strips for each replication separately as shown in the fig.

Step 2: Vertical Factor Randomization
Now assign vertical plots by dividing each block into b = 3 vertical strips. Randomly assign three nitrogen levels (N1 to N3) to these strips for each replication independently and separately as shown in given figure.

Example: Data on Grain Yield of Six Varieties of Rice
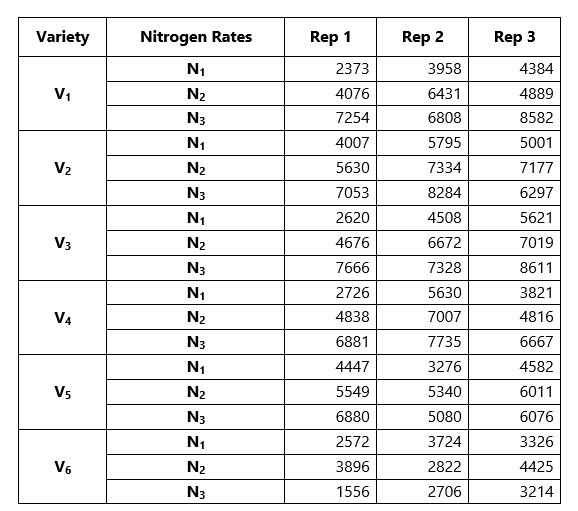
Data on Grain Yield of Six Varieties of Rice, Broadcast Seeded and Grown with Three Nitrogen Rates In a Strip-plot Design with Three Replications given in the following table

Step 3: Data Arrangement
The observations/data on various characters of your interest are arranged in following manner using Excel or any text editor. The first column represent horizontal factor (V1 to V6), second column represents vertical factor (N1 to N3), third column represents replications (R1 to R3) and sub sequent columns represent the data recorded for various characters as given below
Code the varieties 1 to 6, Nitrogen levels 1 to 3, replications 1 to 3 and put the codes in first three columns as per following arrangement.
{Factor A level} {Factor B Level} {Replication No} {Char 1} {Char2} … {Char N}.
In our example we have only one character i.e. yield. So data is arranged as given below
1        1        1        2373
1        1        2        3958
1        1        3        4384
1        2        1        4076
1        2        2        6431
1        2        3        4889
1        3        1        7254
1        3        2        6808
1        3        3        8582
2        1        1        4007
2        1        2        5795
2        1        3        5001
2        2        1        5630
2        2        2        7334
2        2        3        7177
2        3        1        7053
2        3        2        8284
2        3        3        6297
3        1        1        2620
3        1        2        4508
3        1        3        5621
3        2        1        4676
3        2        2        6672
3        2        3        7019
3        3        1        7666
3        3        2        7328
3        3        3        8611
4        1        1        2726
4        1        2        5630
4        1        3        3821
4        2        1        4838
4        2        2        7007
4        2        3        4816
4        3        1        6881
4        3        2        7735
4        3        3        6667
5        1        1        4447
5        1        2        3276
5        1        3        4582
5        2        1        5549
5        2        2        5340
5        2        3        6011
5        3        1        6880
5        3        2        5080
5        3        3        6076
6        1        1        2572
6        1        2        3724
6        1        3        3326
6        2        1        3896
6        2        2        2822
6        2        3        4425
6        3        1        1556
6        3        2        2706
6        3        3        3214
If you have data on more characters then these data are arranged in the right of yield data one after another.
Step 4: Data Submission
Copy data and paste it in the area in data entry web page. Also specify the character names in right side text area. Please use short character names and these should contain any space. The page will look like.
Now press submit button and you will another web page as shown below
Enter the Total Variables, levels of first factor, levels of second factor and number of replications in the text boxes provided in front of each. After entering the parameters press Analyse button. The results are shown in another page.