Latin Square Design
The Latin square (LS) design can simultaneously handle two known sources of variation among experimental units. The source of variations is treated as two independent blocking criteria i.e. row-blocking and column blocking. The blocking is done in such a way that every treatment occurs only once in each row-block and once in each column-block. The estimated variation among row block and among column block is removed from experimental errors. In Latin Square design the number of replication must be equal to number of treatments or varieties.
Where to use Latin Square Design
- When the experimental area has fertility gradient in both directions and field has residual effects from previous trials.
- Greenhouse trials in which the experimental pots are arranged in straight line perpendicular to the glass or screen walls, such that the difference among rows of pots and the distance from the glass wall (or screen wall) are expected to be the two major sources of variability among the experimental pots.
- Laboratory trials with replication over time, such that the difference among experimental units conducted at the same time and among those conducted over time constitute the two known sources of variability.
Thus, in practice, the LS design is applicable only for experiments in which the number of treatments is not less than four and not more than eight. Because of such limitation, the LS design has not been widely used in agricultural experiments despite its great potential for controlling experimental error.
Analysis of Data
The data analysis consists of the following steps:
- For performing analysis, input the data in such a way that the first column contains the row number, the second column contains the column number, and the third column contains treatment number and in the fourth column onwards the data for various characters. All the characters can be entered in the same file provided they have the same type of Latin square. For example, we have a 5 X 5 Latin square as given below. The figures represent the data related to the number of branches and the alphabets represent treatments.
Example Data
| B 15 |
A 8 |
E 17 |
D 20 |
C 17 |
| 9 C |
21 B |
19 D |
16 A |
13 E |
| 18 E |
12 C |
23 A |
8 B |
17 D |
| 18 D |
16 E |
10 B |
15 C |
23 A |
| 22 D |
15 E |
13 B |
18 C |
10 A |
| Row | Col | Treatment | Charact 1 | Charac 2 | … | … | Charac n |
|---|---|---|---|---|---|---|---|
| 1 | 1 | 2 | 15 | ||||
| 1 | 2 | 1 | 8 | ||||
| 1 | 3 | 5 | 17 | ||||
| 1 | 4 | 4 | 20 | ||||
| 1 | 5 | 3 | 17 | ||||
| 2 | 1 | 1 | 9 | ||||
| 2 | 2 | 4 | 21 | ||||
| 2 | 3 | 3 | 19 | ||||
| 2 | 4 | 5 | 16 | ||||
| 2 | 5 | 2 | 13 | ||||
| 3 | 1 | 3 | 18 | ||||
| 3 | 2 | 2 | 12 | ||||
| 3 | 3 | 4 | 23 | ||||
| 3 | 4 | 1 | 8 | ||||
| 3 | 5 | 5 | 17 | ||||
| 4 | 1 | 5 | 18 | ||||
| 4 | 2 | 3 | 16 | ||||
| 4 | 3 | 1 | 10 | ||||
| 4 | 4 | 2 | 15 | ||||
| 4 | 5 | 4 | 23 | ||||
| 5 | 1 | 4 | 22 | ||||
| 5 | 2 | 5 | 15 | ||||
| 5 | 3 | 2 | 13 | ||||
| 5 | 4 | 3 | 18 | ||||
| 5 | 5 | 1 | 10 |
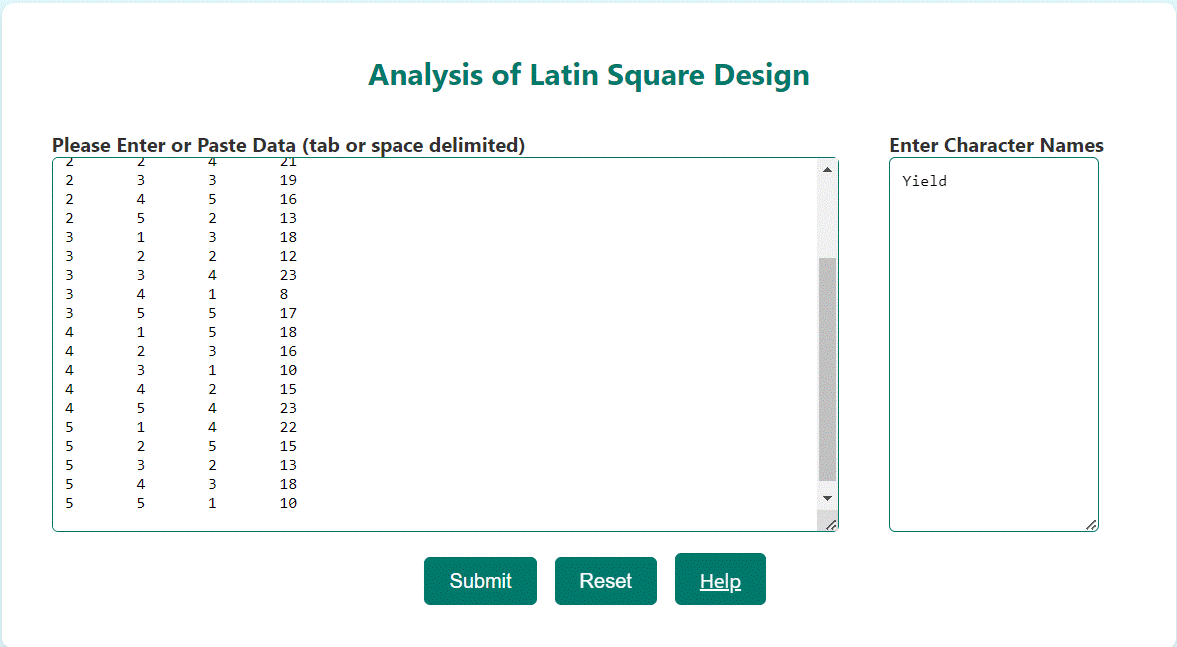
Here charac 2, charac 3, .... charac n represent various characters data such as yield, no of tillers, root length, shoot length etc. You can either enter the data in the text area putting at least one space between observations or you can enter the data in MS Excel then copy it and paste in the text area. Please keep one thing in mind that put only numeric data in the text area. The character names can be entered in another area adjacent to the data area. Keep the character names small and should not contain any spaces. Since we have only one character hence your data looks like:

Step 2
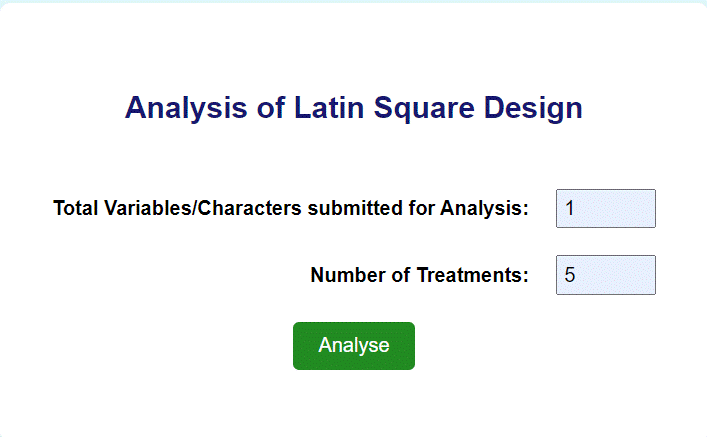
After entering the data as well as character names, press the submit button and a new web page will open where we have to supply the number of characters and the number of treatments in the text boxes as shown below.

Step 3
Press the Analyze button after entering the required information. The results will be displayed on a separate web page.